Market Trends
July 30, 2026
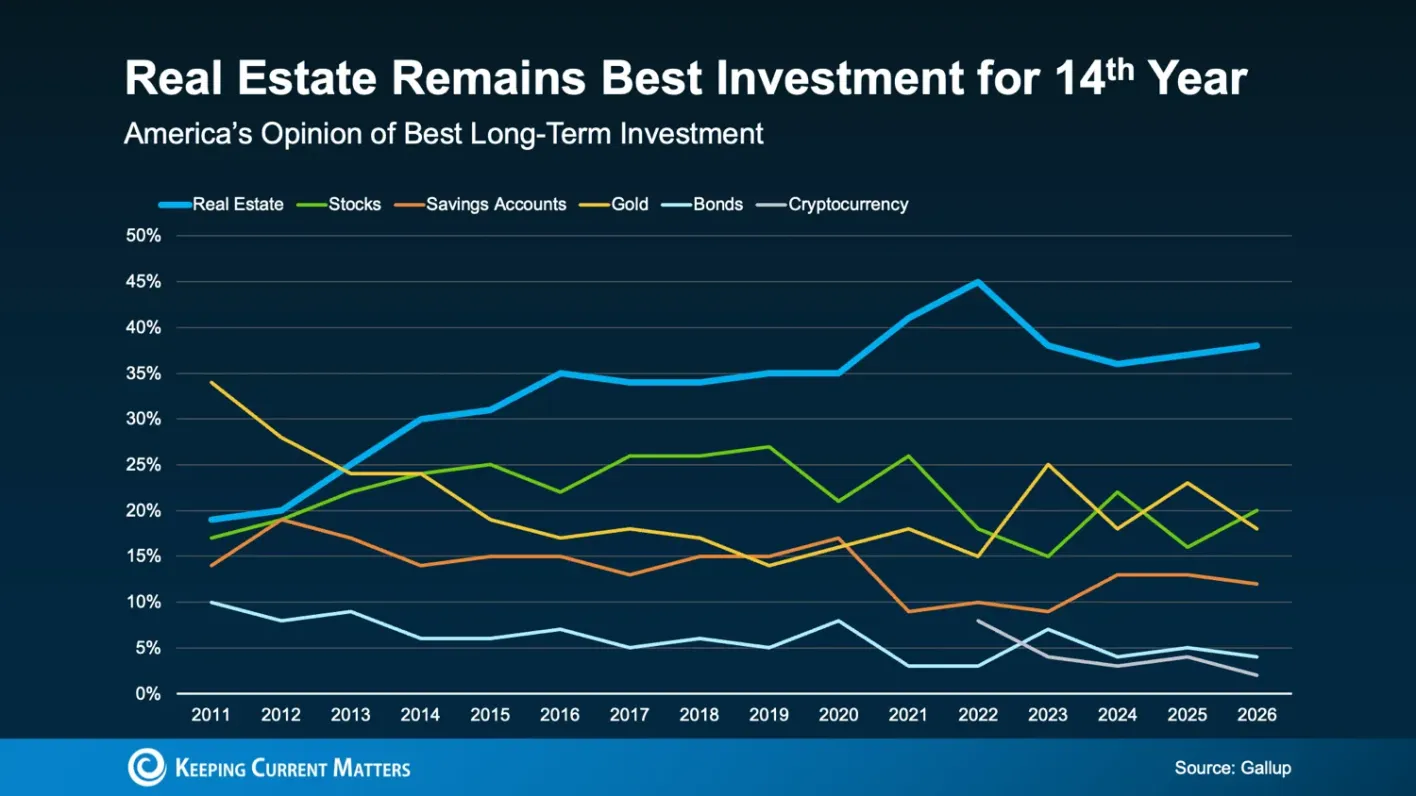
Americans Choose Real Estate as Best Investment – 14th year in a Row!
We love hearing it….and it doesn’t get old; Citing recent data from Gallup, Keeping Current Matters is reporting that more Americans prefer real estate over other long-term investment vehicles for growing wealth – for the 14th year in a row! Overall, when the numbers are broken down, the numbers show that 38% prefer real estate, 20% prefer stocks & bonds, 18% prefer gold, 12% prefer CDs/bank accounts, 4% prefer bonds, 2% prefer crypto and 6% said other.

Market Trends
July 29, 2026
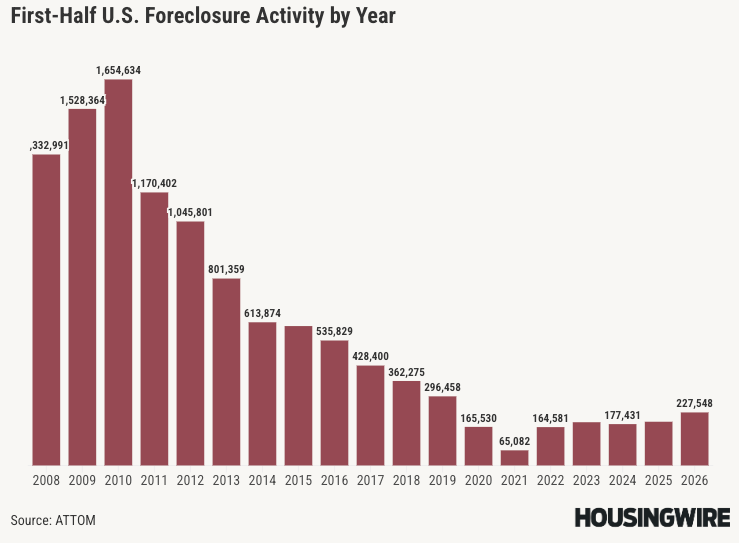
First-Half Foreclosure Activity by Year 2008-2026
Regular readers will know that we cover foreclosure activity on here quite a bit. Citing data from ATTOM, a recent Daily Download from HousingWire listed out 18 years’ worth (2008-2026) of first-half foreclosure data.
Market Trends
July 27, 2026
Zumper’s Rent Versus Buy Report – 2026
A new report from Zumper says that whether it’s better to rent or buy depends on local market conditions and there are two key metrics help compare the costs. The first is the price-to-rent ratio, which divides a market’s median home price by one year of median rent. Generally, ratios above 21 favor renting, below 15 favor buying, and 15–21 indicate a balanced market. Across more than 80 markets analyzed, the national midpoint is about 20. The second metric is the PITI cost delta, which compares a monthly mortgage payment—including principal, interest, taxes, and insurance—to monthly rent, showing the immediate monthly cost difference between buying and renting. Be sure to check out their entire list of 83 cities.
Market Trends
July 21, 2026
Housing Starts Jump 19% in June
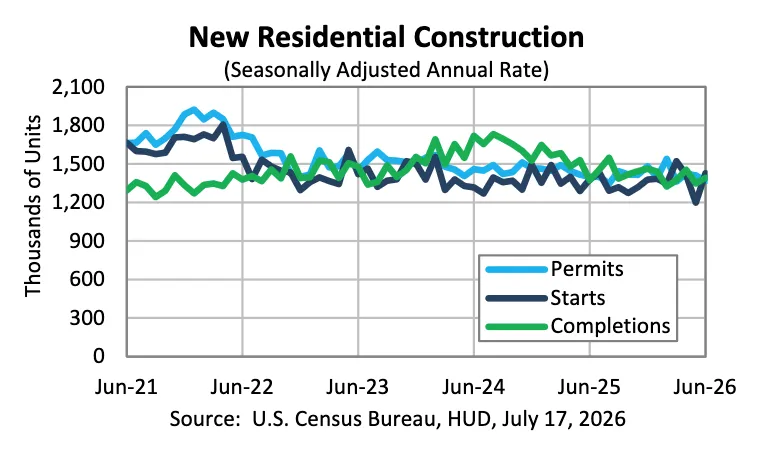
The U.S. government is reporting that privately‐owned housing starts in June, 2026 were at a seasonally adjusted annual rate of 1,427,000, which is 19% higher than May’s revised number and is 3.5% higher than one year ago. June’s rate for buildings with five units or more was 513k. Privately‐owned housing units authorized by building permits in June were at a seasonally adjusted annual rate of 1,367,000, which is 3% lower than May’s revised number and is 2.3% lower than one year ago. Authorizations of units in buildings with five units or more were at a rate of 445k in June.
Market Trends
July 20, 2026
Pending Home Sales Down 5.4% in June
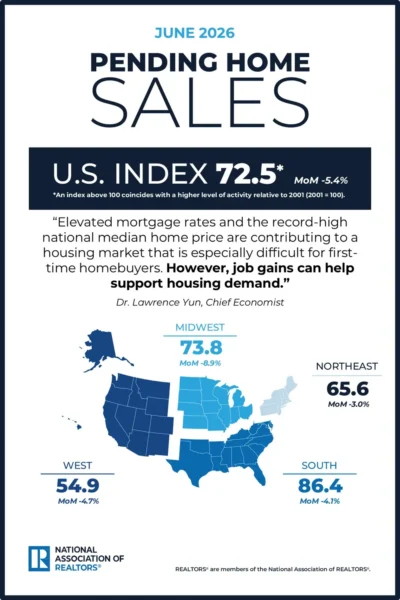
The National Association of Realtors is reporting that pending home sales were down 5.4% in June and down 0.3% year over year. The NAR’s Pending Home Sales Index (a forward-looking indicator based on contract signings) came in at 73.8 in June. Month-over-month declined in all four major U.S. regions and year-over-year pending home sales increased in the Northeast and Midwest but declined in the South and West.
Market Trends
July 20, 2026
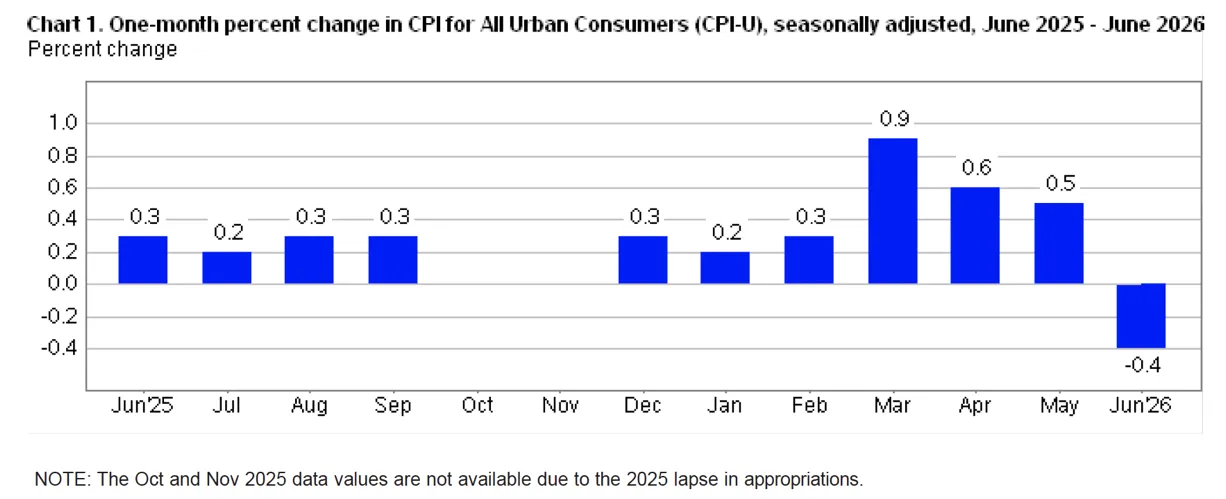
Inflation Sees Biggest One Month Drop Since 2020
The U.S. Bureau of Labor Statistics is reporting that the Consumer Price Index for All Urban Consumers (CPI-U) decreased 0.4% on a seasonally adjusted basis in June. The BLS says this decline in the all items index was the largest 1-month decrease since April 2020 when it fell 0.8%. Over the last 12 months, the all items index increased 3.5% before seasonal adjustment. The index for all items less food and energy rose 2.6% over the past 12 months and the shelter index increased 3.3% over the last year.