

IPS Market Intelligence released its U.S. Multifamily Outlook for 2026, and the headline is worth taking seriously: market fundamentals are stabilizing, but performance is going to be highly market-specific from here. That’s a polite way of saying the days of a rising tide lifting all boats are over. Where you own matters. How you operate matters more.
Here’s what the data shows, and what it means for investors in Colorado and the Mountain West.
The national picture
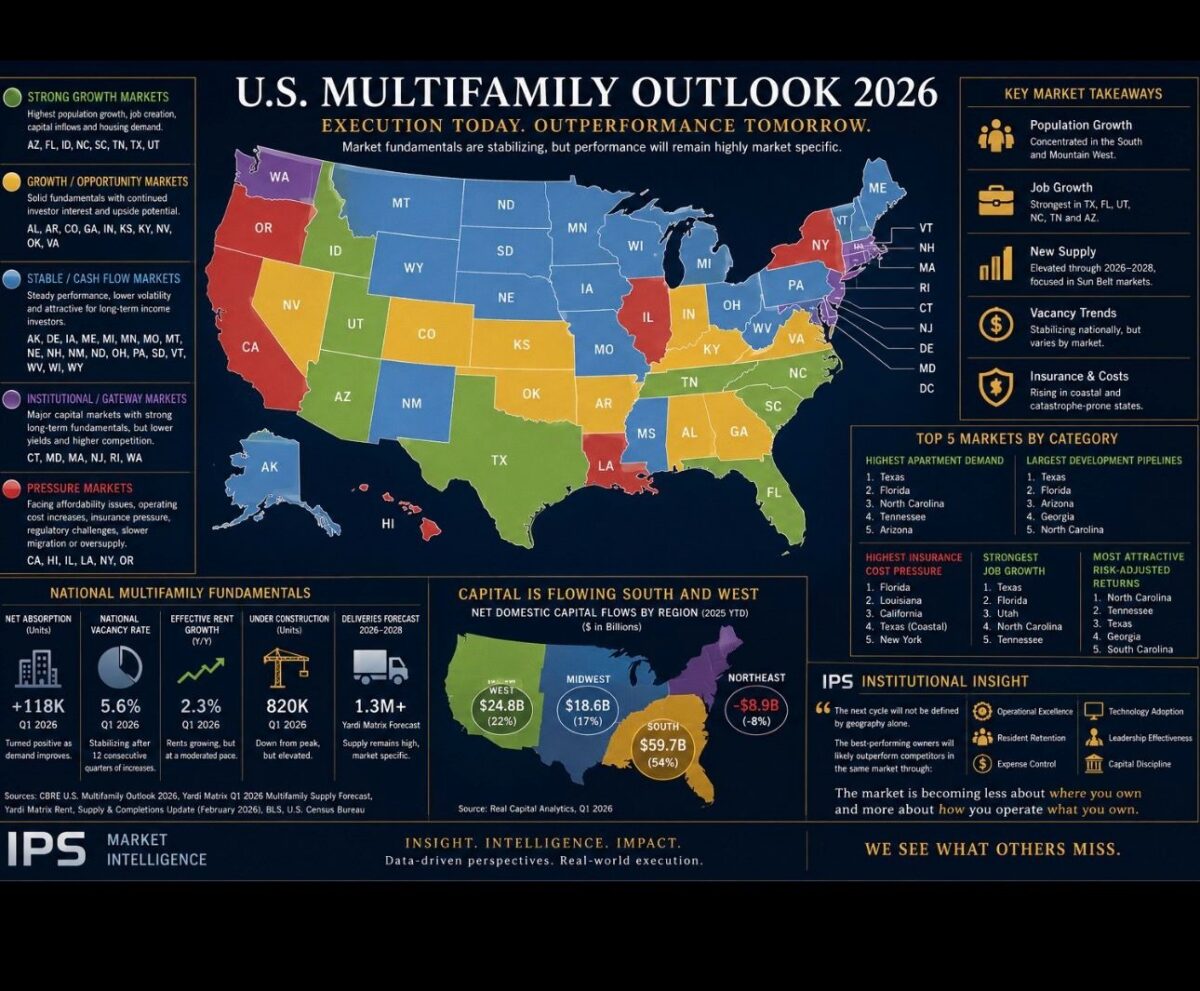
Net absorption turned positive in Q1 2026, adding 118,000 units as demand began to recover. National vacancy sits at 5.6%, stabilizing after 12 consecutive quarters of increases. Effective rent growth is running at 2.3% year over year, which is modest but real. The bigger number to watch is supply: 820,000 units are currently under construction, down from the peak, and Yardi Matrix projects more than 1.3 million new deliveries between 2026 and 2028. Supply is elevated and it is not evenly distributed.
That last point is the one that will define a lot of investor outcomes over the next two years. Markets in the Sun Belt absorbed the heaviest construction pipelines and are now working through oversupply. Markets that didn’t overbuild are in better shape on vacancy and rent growth. Knowing which category your market falls into is not optional information right now.
Where Colorado lands
Colorado is classified in the report as a Growth and Opportunity Market. The description: solid fundamentals, continued investor interest, and upside potential. That’s a meaningfully better position than the Pressure Markets category, which includes California, Hawaii, Illinois, Louisiana, New York, and Oregon. Those markets are dealing with affordability problems, rising operating costs, insurance pressure, regulatory challenges, and in some cases outright oversupply.
Colorado is not immune to those pressures. Insurance costs are rising here, particularly on the Front Range, and the legislative environment has gotten more complicated for landlords over the past two years. But on the national classification scale, Colorado investors are in a better starting position than many of their peers in coastal and high-cost markets.
The capital flow story
The infographic’s capital flow data is striking. Net domestic capital flows into the South totaled $59.7 billion in 2025, representing 54% of all multifamily investment. The West pulled in $24.8 billion (22%). The Midwest attracted $18.6 billion (17%). The Northeast saw a net outflow of $8.9 billion, meaning more capital left than entered.
Capital is not sentimental. It follows rent growth, population trends, job creation, and relative affordability. The South and Mountain West are checking those boxes. The Northeast and parts of the coastal West are not. For Colorado investors, being in a market that is attracting capital rather than losing it matters for exit valuations, buyer depth, and financing availability when you want to sell.
The markets getting the most attention
Texas leads on apartment demand, development pipeline, and job growth. Florida shows up in the highest insurance cost pressure category alongside Louisiana, California, Texas Coastal, and New York. That is a real risk for investors in those markets: insurance expense is compressing NOI in ways that weren’t modeled when those properties were acquired.
The most attractive risk-adjusted returns category is worth noting: North Carolina leads, followed by Tennessee, Texas, Georgia, and South Carolina. These are markets with population growth, job diversification, relative affordability, and more manageable regulatory environments than coastal alternatives. They are also the markets Colorado investors increasingly come up against when competing for capital allocation decisions.
The Mountain West position
The report lists Arizona, Colorado, Idaho, Nevada, and Utah among the Growth and Opportunity markets. Population growth in the South and Mountain West is the top takeaway under Key Market Takeaways, and job growth is listed as strongest in Texas, Florida, Utah, North Carolina, Tennessee, and Arizona. Utah and Colorado are in that same regional growth story.
Wyoming, meanwhile, sits in the Stable and Cash Flow category alongside a list of states that includes Iowa, Montana, the Dakotas, and several others. That classification reflects steadier, lower-volatility performance rather than strong growth, which is consistent with what investors looking at Cheyenne and Casper are finding: solid fundamentals, less competition, and a simpler operating environment.
What to take away from this
The IPS framing at the bottom of the report says it directly: the next cycle will not be defined by geography alone. The best-performing owners will outperform competitors in the same market through operational excellence, resident retention, expense control, technology adoption, leadership effectiveness, and capital discipline.
That’s a shift worth paying attention to. For years, being in the right market was enough to cover operational mediocrity. That period is over. The investors in this community who are already focused on occupancy, resident experience, and expense management are better positioned for the next two to three years than investors who are still counting on market appreciation to do the work.
Colorado is in a solid position on the national map. That’s not a reason to relax. It’s a reason to execute.
Source
IPS Market Intelligence, U.S. Multifamily Outlook 2026. Underlying data sources cited by IPS: CBRE U.S. Multifamily Outlook 2026, Yardi Matrix Q1 2026 Multifamily Supply Forecast, Yardi Matrix Rent/Supply/Completions Update (February 2026), BLS, U.S. Census Bureau, Real Capital Analytics Q1 2026.